Monitoring burn outcomes on the Mt. Adams Community Forest

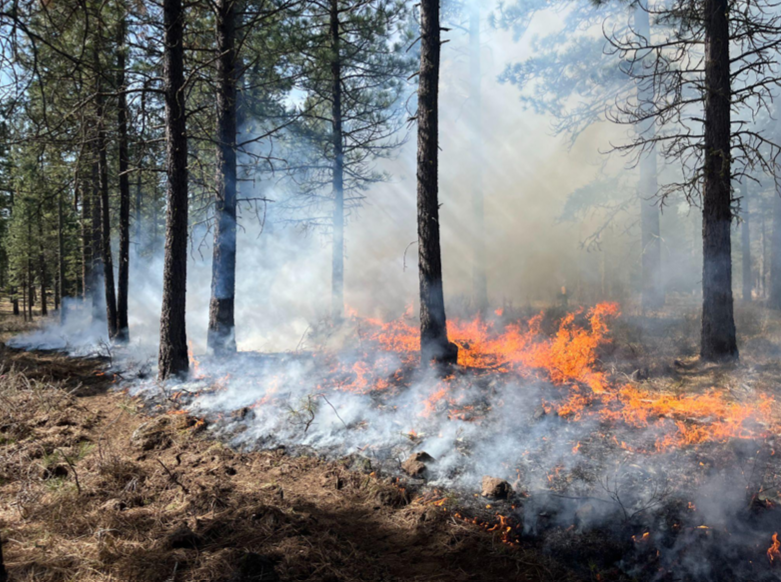
Smoke column from a prescribed burn on the Community Forest, viewed across Conboy Lake National Wildlife Refuge, near Glenwood (April 2025). Credit for all photos in this article to: David Ryan & Elle Luedloff
Once the excitement of a prescribed burn on the Mt. Adams Community Forest is over – the drip torches packed away, the hot spots cooled, the smoke subsided – a new process begins. The forest, in its quiet and incremental way, recovers from and responds to the fire. And Dave Ryan, MARS’s Monitoring Coordinator, takes a moment to watch.
MARS uses prescribed fire to accomplish a variety of forest health and resilience goals in our area’s dry, fire-adapted ecosystems. By intentionally igniting the forest floor, we’re trying to replicate the low-intensity, frequent fire that historically benefitted these forests by improving wildlife habitat and forage, returning nutrients to the soil, and removing surface fuels that could otherwise feed a catastrophic wildfire. Our monitoring program helps us understand whether our burns are meeting these objectives, and, in turn, how we can better manage future entries of prescribed fire to achieve desired results.
Take these two recent prescribed burns on the Pine Flats tract of the Mt. Adams Community Forest: one 38-acre burn in October 2024, and one 28-acre entry in April 2025. We’ll highlight two metrics Dave measured pre- and post-burn to monitor effects on the forest.
October 2024: Reduction in fuel loading after a fall burn
The metric: Fuel loading refers to the quantity of combustible material (e.g., twigs, logs, pine needles, live and dead plants) on the ground in a given area, typically measured in tons per acre. Areas with higher fuel loading are generally expected to support more intense fire behavior and spread. As such, it’s often one of our objectives to reduce fuel loading with prescribed burns, thus reducing the risk of high-severity wildfire.
The methods: Dave measured fuel loading before and after our October burn. He used the photoload method, which involves comparing observed fuels with photos of pre-measured amounts of fuel.

The results: We observed 70-80% reductions in fuel loading across three representative plots in the burned area. In other words, the burn thoroughly consumed material on the forest floor. The result is in alignment with our objectives for the prescribed burn, which aimed for a >50% reduction in vegetative cover and litter. If a wildfire were to spread into this area, it would likely slow and lower in intensity – there simply isn’t as much material for it to burn anymore.

Burn conditions: It’s helpful to connect post-burn monitoring data with weather and fire behavior data from the day of the burn. That way, we can better understand what to expect from future burns under similar weather conditions and seasonality. Here’s what MARS Stewardship Crew member Elle Luedloff reported from our October 2024 burn day:

Notable fire behavior observations: maximum flame height of 4-5 ft at 12:00, and occasional “torching” of trees around 10 feet in height.
The takeaway: Elle’s report suggests fairly mild and cool weather conditions (high of 59 degrees, with 40% humidity and minor winds). Yet, Dave’s monitoring plots still showed a substantial reduction in fuel loading, suggesting that the prescribed fire had sufficient intensity to consume much of the material on the ground. He also noted in his report that, anecdotally, vegetative regrowth following the burn has occurred more slowly than in similar units burned in the spring, indicating a higher-intensity burn. These observations suggest the strong influence of seasonality on how fire impacts our ecosystems. In the fall, combustible material and soil have had a full summer to dry out. Even under the mild weather conditions of our October burn, these materials were readily burnable.
April 2025: Limited tree mortality after a spring burn
The metric: While fuel loading measurements can help us understand how prescribed fire reduces wildfire hazard potential, other metrics tell the story of how burns impact forest structure and tree health. Crown scorch and bole char indicate how much of a mature tree’s crown or trunk, respectively, show signs of heat damage. Sapling counts pre- and post-burn show how many smaller trees were killed during the burn.
The methods: In one representative plot on this burn unit, Dave measured 14 mature (>8” diameter) trees and counted the number of saplings (<8” diameter). Then, after the burn, he revisited each of the mature trees, measuring crown scorch (percentage of the tree’s total crown that turned yellow or reddish from the fire) and bole char (the height, in feet, that the trunk was blackened). He also re-counted the number of saplings in the plot area.

The results: Bole char and crown scorch on the large trees was minimal. One tree had about 55% crown scorch (for a ponderosa pine, this is unlikely to kill the tree), but all others had 0-10% scorch. Bole char was observed at an average height of 6 ft on trees (again, a non-lethal impact). There was a 34.5% reduction in the number of saplings (10 out of 29 were killed).

Burn conditions: Once again, we can compare monitoring results to the weather and fire behavior observed on burn day (thank you, Elle!).
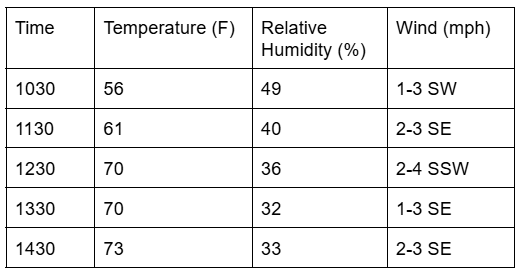
Notable fire behavior observations: maximum of 3-4 ft flame heights, some ignition and consumption of young fir trees, and consumption of bitterbrush only where there were readily-combustible pine needles nearby.
The takeaway: Reading only the weather observations above, you might expect this April burn to be far more intense than our October burn – the temperature climbed nearly 15 degrees higher and the relative humidity was significantly lower. Yet, Dave and Elle’s observations tell a more nuanced story. Flame heights were similar between both burns. There was minimal impact to the large overstory trees during the April burn, with occasional consumption of smaller trees (in alignment with burn objectives). Again, we likely see the influence of seasonality: during a spring burn, the wetter soil and large woody debris likely moderated the effects of otherwise hotter and drier weather conditions. Given that we did not want to inflict substantial mortality among our large trees, these conditions helped us achieve the ecological results we were aiming for.
Conclusion
Prescribed fire is a science and an art. MARS and partners continue to collect observations and data to better understand how our forests will respond to burns in different contexts, weather conditions, and seasons. Complementing these monitoring efforts, we also rely heavily on the vast and growing bank of local knowledge among our staff. MARS Stewardship Crew members and other staff work and play on these lands everyday, learning the vegetation, fuels, and weather patterns intimately. Increasingly, we also pull from the knowledge of local community members stewarding their lands through “good fire” via the Mt. Adams Prescribed Burn Association. We encourage you to get involved and join us for a burn. And read more about Dave’s monitoring program here!
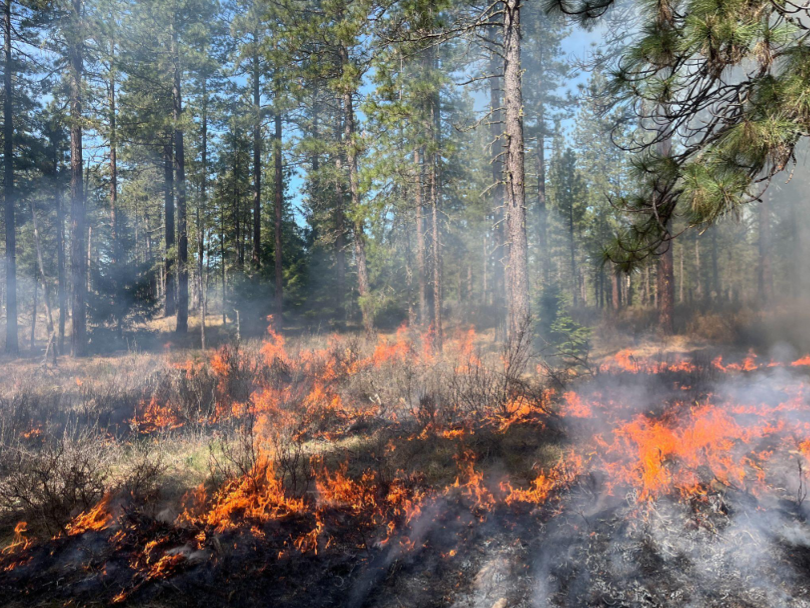
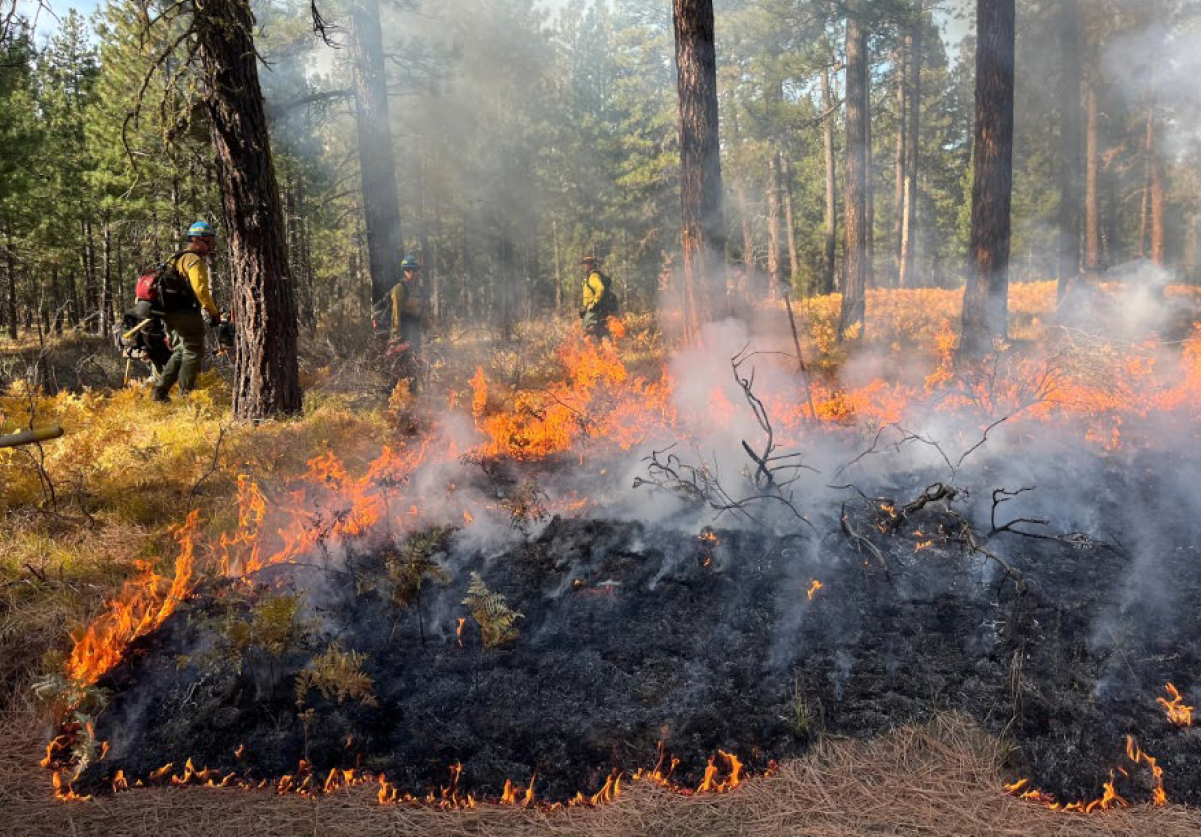
During the spring 2025 burn.